Croptivize
Abstract
Problem Statement
A web-based tool called Croptivize aims to empower farmers by offering a user-friendly platform for diagnosing and treating crop diseases. Based on visual symptoms, the website uses machine learning and image recognition to diagnose illnesses and recommend treatments and preventative measures. Farmers can determine whether a plant is diseased, what kind of disease it is, and how to treat it by just snapping a photo of its leaf or uploading one from the gallery. To offer tailored suggestions depending on regional climate conditions, the website will also incorporate real-time weather data. To facilitate disease management and improve overall agricultural productivity, it will also incorporate an e-commerce platform that links farmers with major fertilizer companies and top suppliers of fertilizers, pesticides, and other agricultural products. Farmers, who frequently deal with crop diseases that can drastically affect their yield and revenue, are the project's main beneficiaries. The app will enable farmers to make well- Introduction 2 informed decisions and maximize their crop management techniques by offering prompt and precise disease detection and treatment recommendations. The nation's economy will eventually benefit from this project's increased agricultural productivity, decreased crop losses, and enhanced food quality. Furthermore, businesses such as Engro Fertilizers Limited Fauji Fertilizers will benefit from the advertising opportunities our app presents, enabling them to reach the target market more effectively.
Farmers, especially in developing regions, struggle to accurately diagnose and treat crop diseases due to limited expert access, delayed detection, and unreliable information. These challenges lead to poor yields, financial losses, and inefficient resource use. There is a need for a real-time, accessible solution that considers local climate and provides accurate disease identification, treatment advice, and access to reliable agricultural products. Croptivize addresses this by using machine learning, image recognition, and weather data to offer personalized support and connect farmers with trusted suppliers.
Architecture Diagram
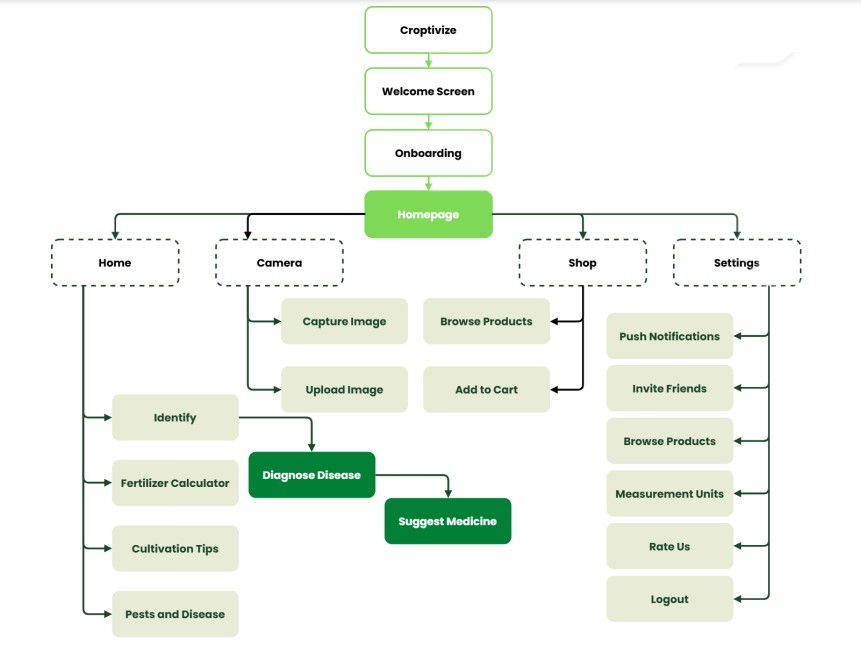
Flow Diagram
Demo Video
Flow Diagram
Demo Video
Architecture Diagram
Placeholder
Placeholder
Placeholder

Demo Video
Flow Diagram
Placeholder
Demo Video
Watch the demo video below for a guided walkthrough of the project's key features and functionality. It offers a clear look at the system's interface, workflow, and how it performs in real-world scenarios.

Demo Video
Architecture Diagram
Explore the project’s source code on GitHub to dive deeper into its structure, logic, and implementation. The repository includes all files, documentation, and version history for those interested in the development process.
View the project poster for a visual summary of the concept, and methodology. It highlights the key components, architectural diagrams, and project outcomes in a concise, easy-to-understand format designed for quick review.
Project Poster
View the project poster for a visual summary of the concept, and methodology. It highlights the key components, architectural diagrams, and project outcomes in a concise, easy-to-understand format designed for quick review.

GitHub Link
Explore the GitHub repository for a complete view of the code, architecture, and implementation process. It provides version history, modular structure, and technical insight in a clear and accessible format.